
Reading your analytics
Volume, conversion and funnel metrics per application - the place to find where users drop off, which feature is driving your spend, and whether a change worked.
Analytics in the sidebar shows volume, approval rate and the step-by-step funnel, per application. Use the funnel to find drop-off and the per-feature volume to explain your bill - both are questions you otherwise end up guessing at.
#What's there
Volume, conversion, and funnel metrics for KYC, KYB, and transaction activity, with widgets you can arrange per application.
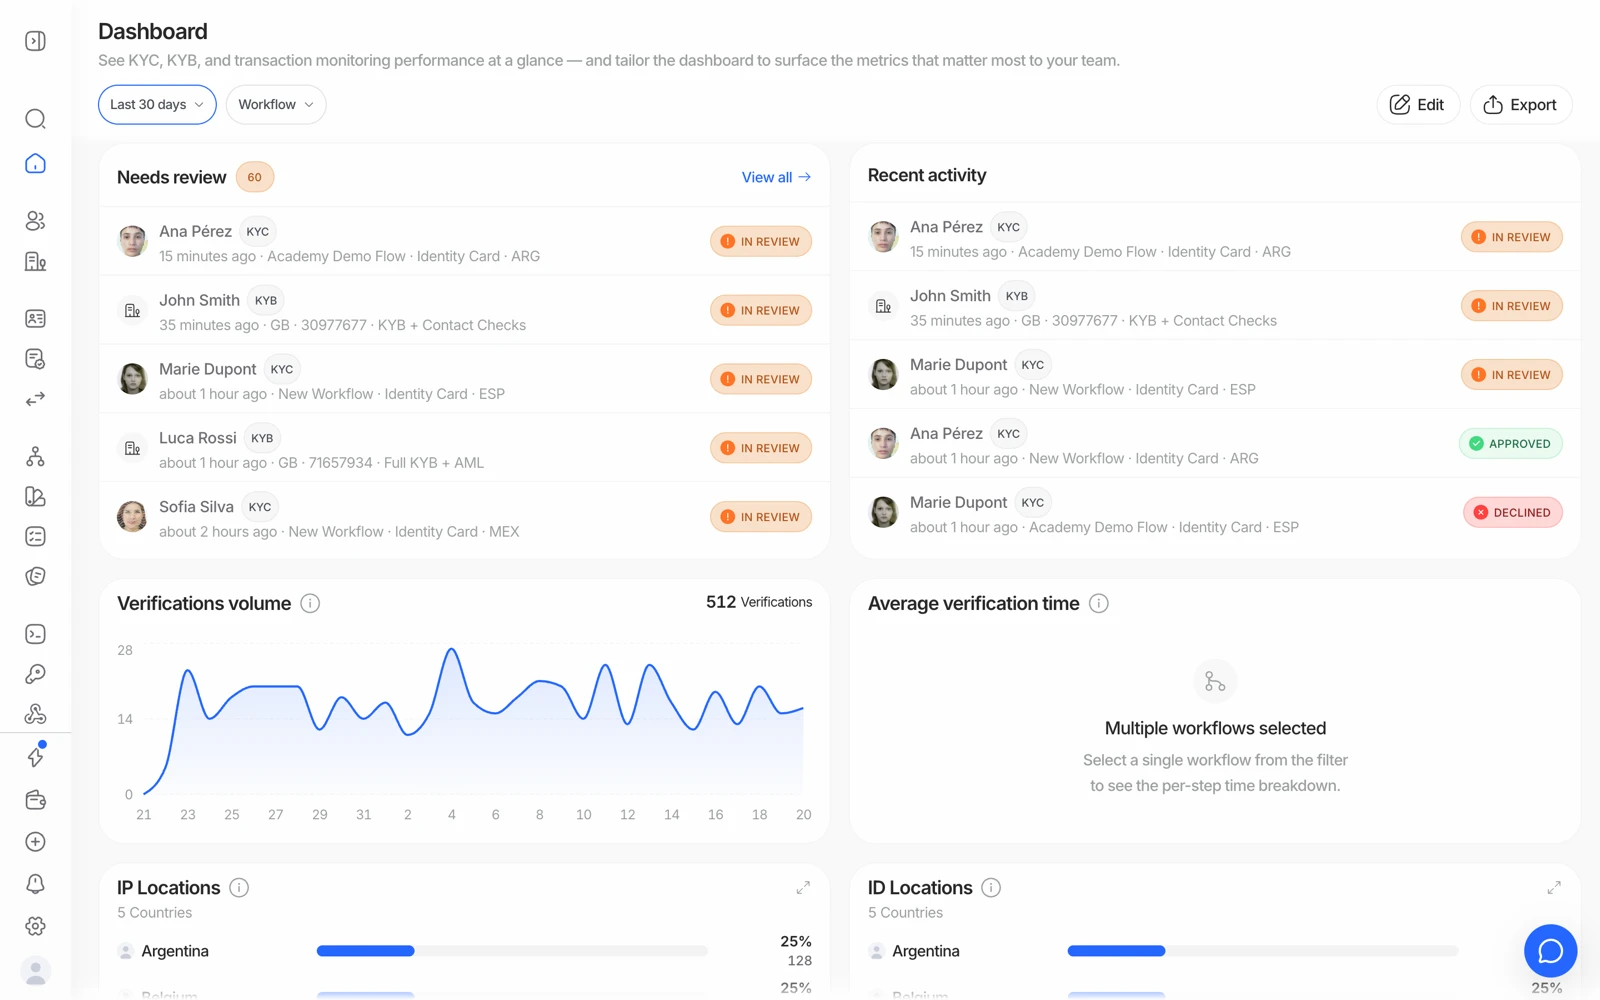
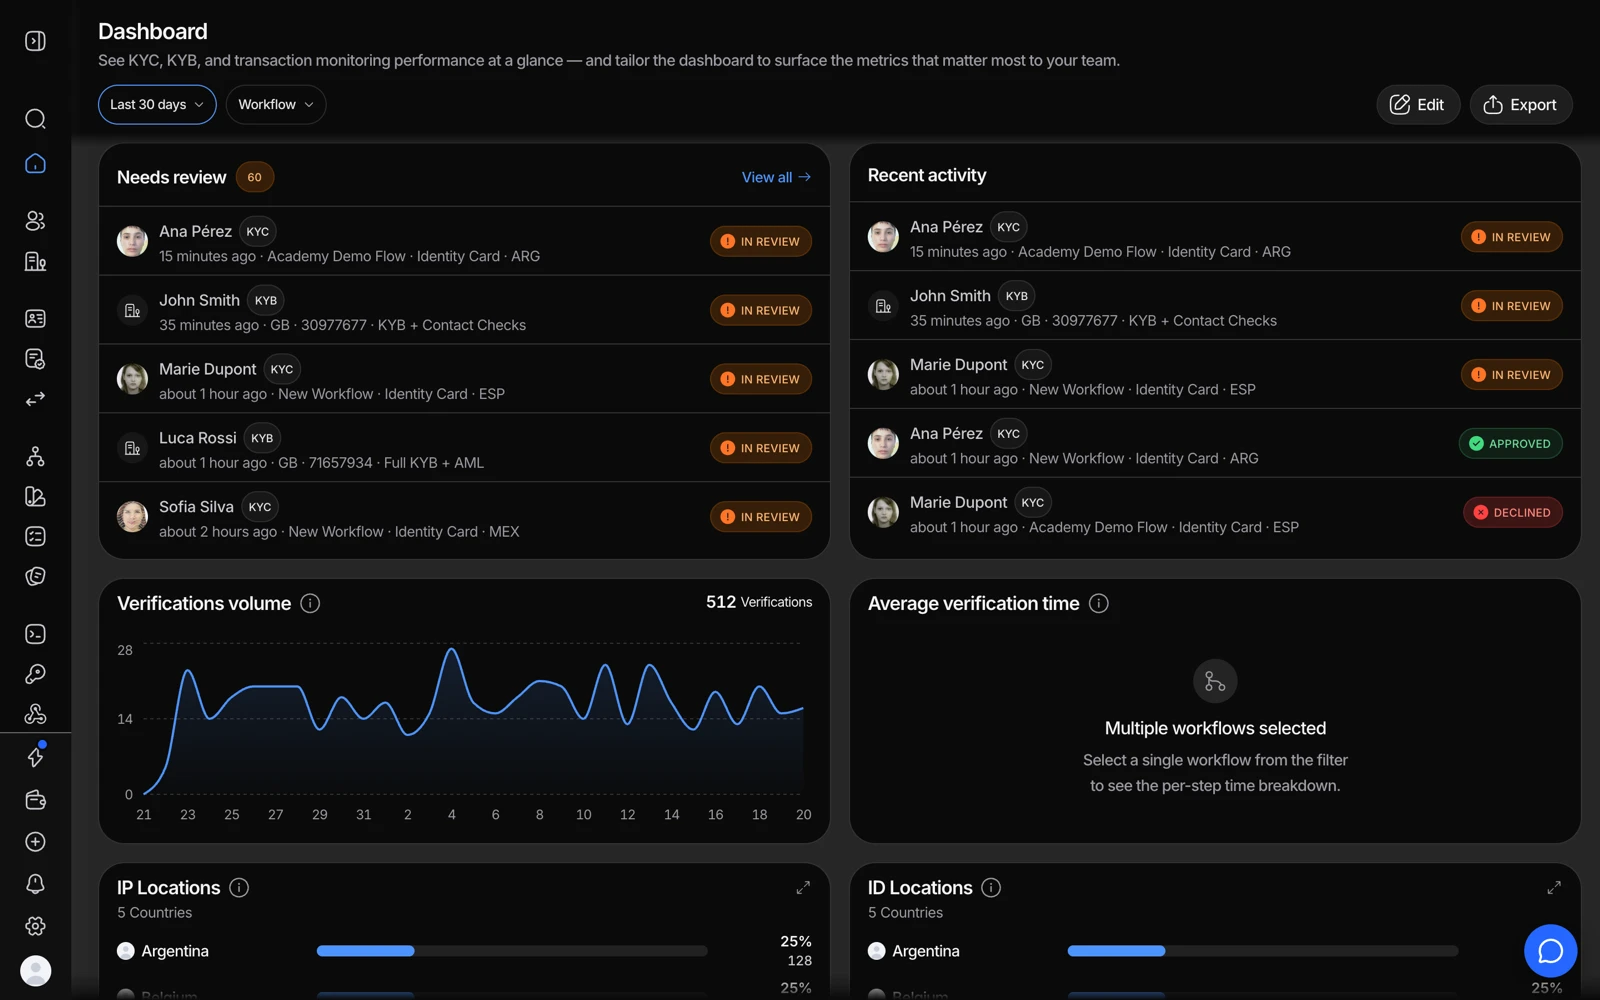
- Volume over the selected range, split by outcome.
- How long users take end to end - a spike here usually means a document or camera problem.
- Where sessions come from, by IP and by document country.
- Edit rearranges the widgets; Export downloads the data behind them.
#The three questions it answers well
"Where are users dropping off?" The funnel shows completion per step, so you stop guessing. Drop-off is usually concentrated in one step, and the step tells you the cause - document selection means a coverage or subtype problem, camera means an environment problem, questionnaire means the form is too long. See when a session never finishes.
"Why is my bill what it is?" Your bill is a function of completed features, so per-feature volume explains it arithmetically. A spend surprise is always a volume surprise on some specific feature. See what counts as a billable check.
"Did that change work?" Compare before and after on the same metric. A threshold change, a step reorder, or a language fix all show up here if they mattered - and if they don't show up, they didn't matter.
#Metrics are per application
Analytics is scoped to the application you have selected, like workflows and keys. If your traffic is split across applications, you're looking at part of the picture - which is worth remembering before concluding that volume fell. See organizations, applications and environments.
Sandbox applications have their own metrics too, and they're meaningless as a measure of real behaviour - the outcomes were chosen, not measured.
#Reading the approval rate honestly
A low approval rate has several very different causes, and the number alone doesn't distinguish them:
- Genuine fraud pressure - the checks are working.
- Thresholds too tight - you're declining real people. See face match scores and thresholds.
- Coverage gaps - users can't use the document they hold, so they fail at selection.
- A review queue nobody works - sessions sit In Review and never become approved, which reads as a low approval rate. See sessions stuck in review.
Before acting on the rate, look at the mix underneath it.
#Freshness
Dashboard figures can lag slightly behind individual sessions - a session you just completed may not be in the aggregate yet. If a number looks wrong immediately after a change, check the underlying session in Verifications rather than concluding the metric is broken.
#Getting the data out
For your own reporting, export session data as CSV from the Verifications list with the columns and filters you choose. For a per-session record, use the PDF. See downloading a verification report.
If you need continuous data in your own warehouse rather than periodic exports, take it from webhooks and aggregate on your side - that's the pattern that scales, and it gives you metrics defined the way your business defines them rather than the way a dashboard does.
#Who can see it
Analytics access follows role, like everything else in the console. If a teammate can't see the section, check their role first. See inviting team members and setting roles.